A Simple Value That Hides a More Complex Analytical Reality
In volatile organic compound (VOC) analysis, results are frequently reported as:
- ppm as toluene equivalent
- mg/m³ as toluene equivalent
This reporting convention is widely used in:
- VOC screening campaigns
- Industrial emissions monitoring
- Environmental assessments
- Process monitoring applications
At first glance, these values may appear to represent the actual concentration of compounds present in a sample. However, this is not always the case.
Understanding the difference between a toluene equivalent concentration and a true compound concentration is essential for correctly interpreting analytical results and assessing the associated uncertainty.
Why Is Toluene Used as the Reference Compound?
Toluene has become the standard reference compound in many VOC measurement methods for several practical reasons:
- High-purity standards are readily available
- Excellent chemical stability
- Consistent analytical performance
- Strong and reproducible response on Flame Ionisation Detectors (FID)
- Representative behaviour for many hydrocarbon compounds
During calibration, a series of known toluene concentrations are analyzed to create a calibration curve linking:
- Detector response
- Corresponding concentration
This calibration curve is then used to convert the signal generated by an unknown sample into a concentration value.
The principle is straightforward:
Every measured signal is interpreted according to the detector response obtained from toluene calibration. In other words, the reported result answers the following question:
What concentration of toluene would generate the same detector signal as my sample?
This is known as toluene equivalency.
Why Toluene Equivalency Is Ideal for VOC Screening
Most industrial, environmental and process samples contain complex mixtures rather than a single VOC.
These mixtures often include:
- Residual solvents
- Light hydrocarbons
- Alcohols
- Ketones
- Esters
- Reaction by-products
- Degradation products
Identifying and quantifying every individual compound requires significantly more sophisticated analytical methods, longer analysis times and higher costs.
Using a toluene equivalent approach provides several practical benefits:
- Rapid estimation of overall VOC levels
- Easy comparison between samples
- Effective trend monitoring over time
- Cost-efficient routine analysis
For these reasons, toluene equivalency remains one of the most valuable tools for VOC screening applications.
The Limitation: Not All Compounds Respond Like Toluene
The concept of toluene equivalency relies on an implicit assumption:
The compound being measured produces a detector response similar to that of toluene.
In reality, this assumption is not always valid.
Detector response depends on several factors, including:
- Chemical structure
- Number of carbon atoms
- Presence of heteroatoms
- Degree of oxygenation
- Detection mechanism employed
In FID analysis, many hydrocarbons generate responses that are relatively close to that of toluene.
However, alcohols, ketones and highly oxygenated compounds often produce significantly different detector responses.
As a result, two compounds present at the same actual concentration may generate very different detector signals.
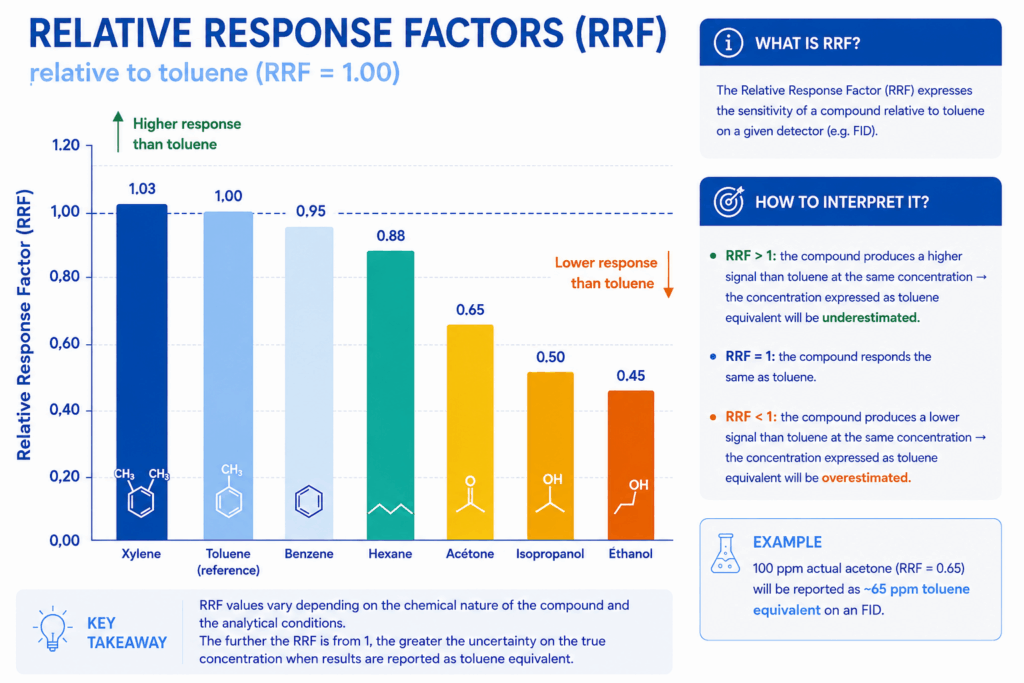
Relative Response Factor: The Key Parameter Behind the Difference
To compare detector sensitivity between different compounds, analysts use the Relative Response Factor (RRF).
By definition:
- RRF = 1: The compound responds exactly like toluene.
- RRF > 1: The compound produces a stronger signal than toluene at the same concentration.
- RRF < 1: The compound produces a weaker signal than toluene at the same concentration.
The further the Relative Response Factor deviates from 1, the greater the potential difference between:
- The true concentration
- The concentration reported as toluene equivalent
This explains why two samples containing the same amount of organic material can display different VOC concentrations when expressed as toluene equivalents.
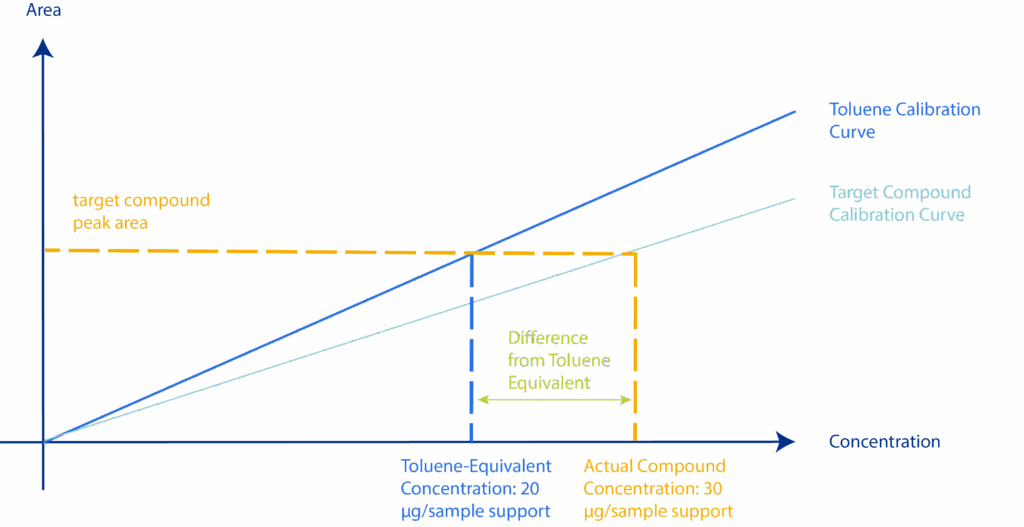
Practical Example: Acetone
Consider a simplified example
An FID instrument is calibrated using toluene. A sample contains :
100 ppm of acetone. Assume the relative response factor for acetone is RRF = 0.65
In this case, the detector signal generated by 100 ppm of acetone would be equivalent to the signal produced by approximately 65 ppm of toluene.
The instrument would, therefore, report :
65 ppm as toluene equivalent even though the actual acetone concentration is 100 ppm
This represents a difference of 35%.
however :
- The instrument is functioning correctly
- The calibration remains valid
- The measurement is reproducible
The discrepancy arises solely from the specific detector response of acetone.
An Often Overlooked Source of Uncertainty
When discussing analytical uncertainty, attention is usually focused on :
- Repeatability
- Instrumental noise
- Detector performance
- Calibration accuracy
These factors are undoubtedly important.
However, when results are reported as toluene equivalents, a second source of uncertainty must also be considered:
Uncertainty associated with the chemical composition of the sample itself.
This contribution is often more difficult to quantify because it depends directly on the compounds present.
The greater the chemical difference between the sample matrix and toluene, the larger the potential gap between:
- Actual VOC concentration
- Reported toluene equivalent concentration
This uncertainty is generally not caused by a measurement error. Instead, it is inherent to the analytical convention used.
What Happens in Complex VOC Mixtures?
The situation becomes even more challenging when a sample contains dozens or even hundreds of VOCs.
In these cases:
- Every compound has its own Relative Response Factor
- Each compound contributes differently to the total detector signal
- The detector measures the sum of all individual contributions
The reported value therefore represents:
A global organic loading expressed relative to a common reference compound.
Toluene equivalent concentration becomes an extremely useful indicator for trend analysis and process monitoring.
However, it should not be interpreted as the absolute concentration of every compound present in the sample.
When Should You Move Beyond Toluene Equivalency?
Toluene equivalency is perfectly suited for:
- Exploratory VOC screening
- Process monitoring
- Sample comparison
- Trend analysis
- Rapid quality control assessments
However, more specific analytical approaches become necessary when:
- Regulations require individual compound quantification
- Toxicological assessments are involved
- The mixture composition is unusual or poorly characterised
- Accurate absolute concentrations are required
In such situations, techniques such as Gas Chromatography-Mass Spectrometry (GC-MS) combined with compound-specific calibration standards provide a more accurate representation of the sample’s chemical composition.
Key Takeaways
Toluene equivalency remains one of the most practical and widely used approaches for VOC screening. It offers a fast, robust and universal way to estimate overall VOC levels across a broad range of applications.
However, a value reported in ppm as toluene equivalent often conceals a more complex chemical reality.
Understanding the role of Relative Response Factors helps analysts, environmental professionals and industrial operators interpret results more accurately and determine when compound-specific quantification is required.
At QUAD-LAB, we do more than generate analytical data. We help our clients understand and interpret their results so that every decision is based on the appropriate level of scientific confidence, regulatory compliance and operational relevance.